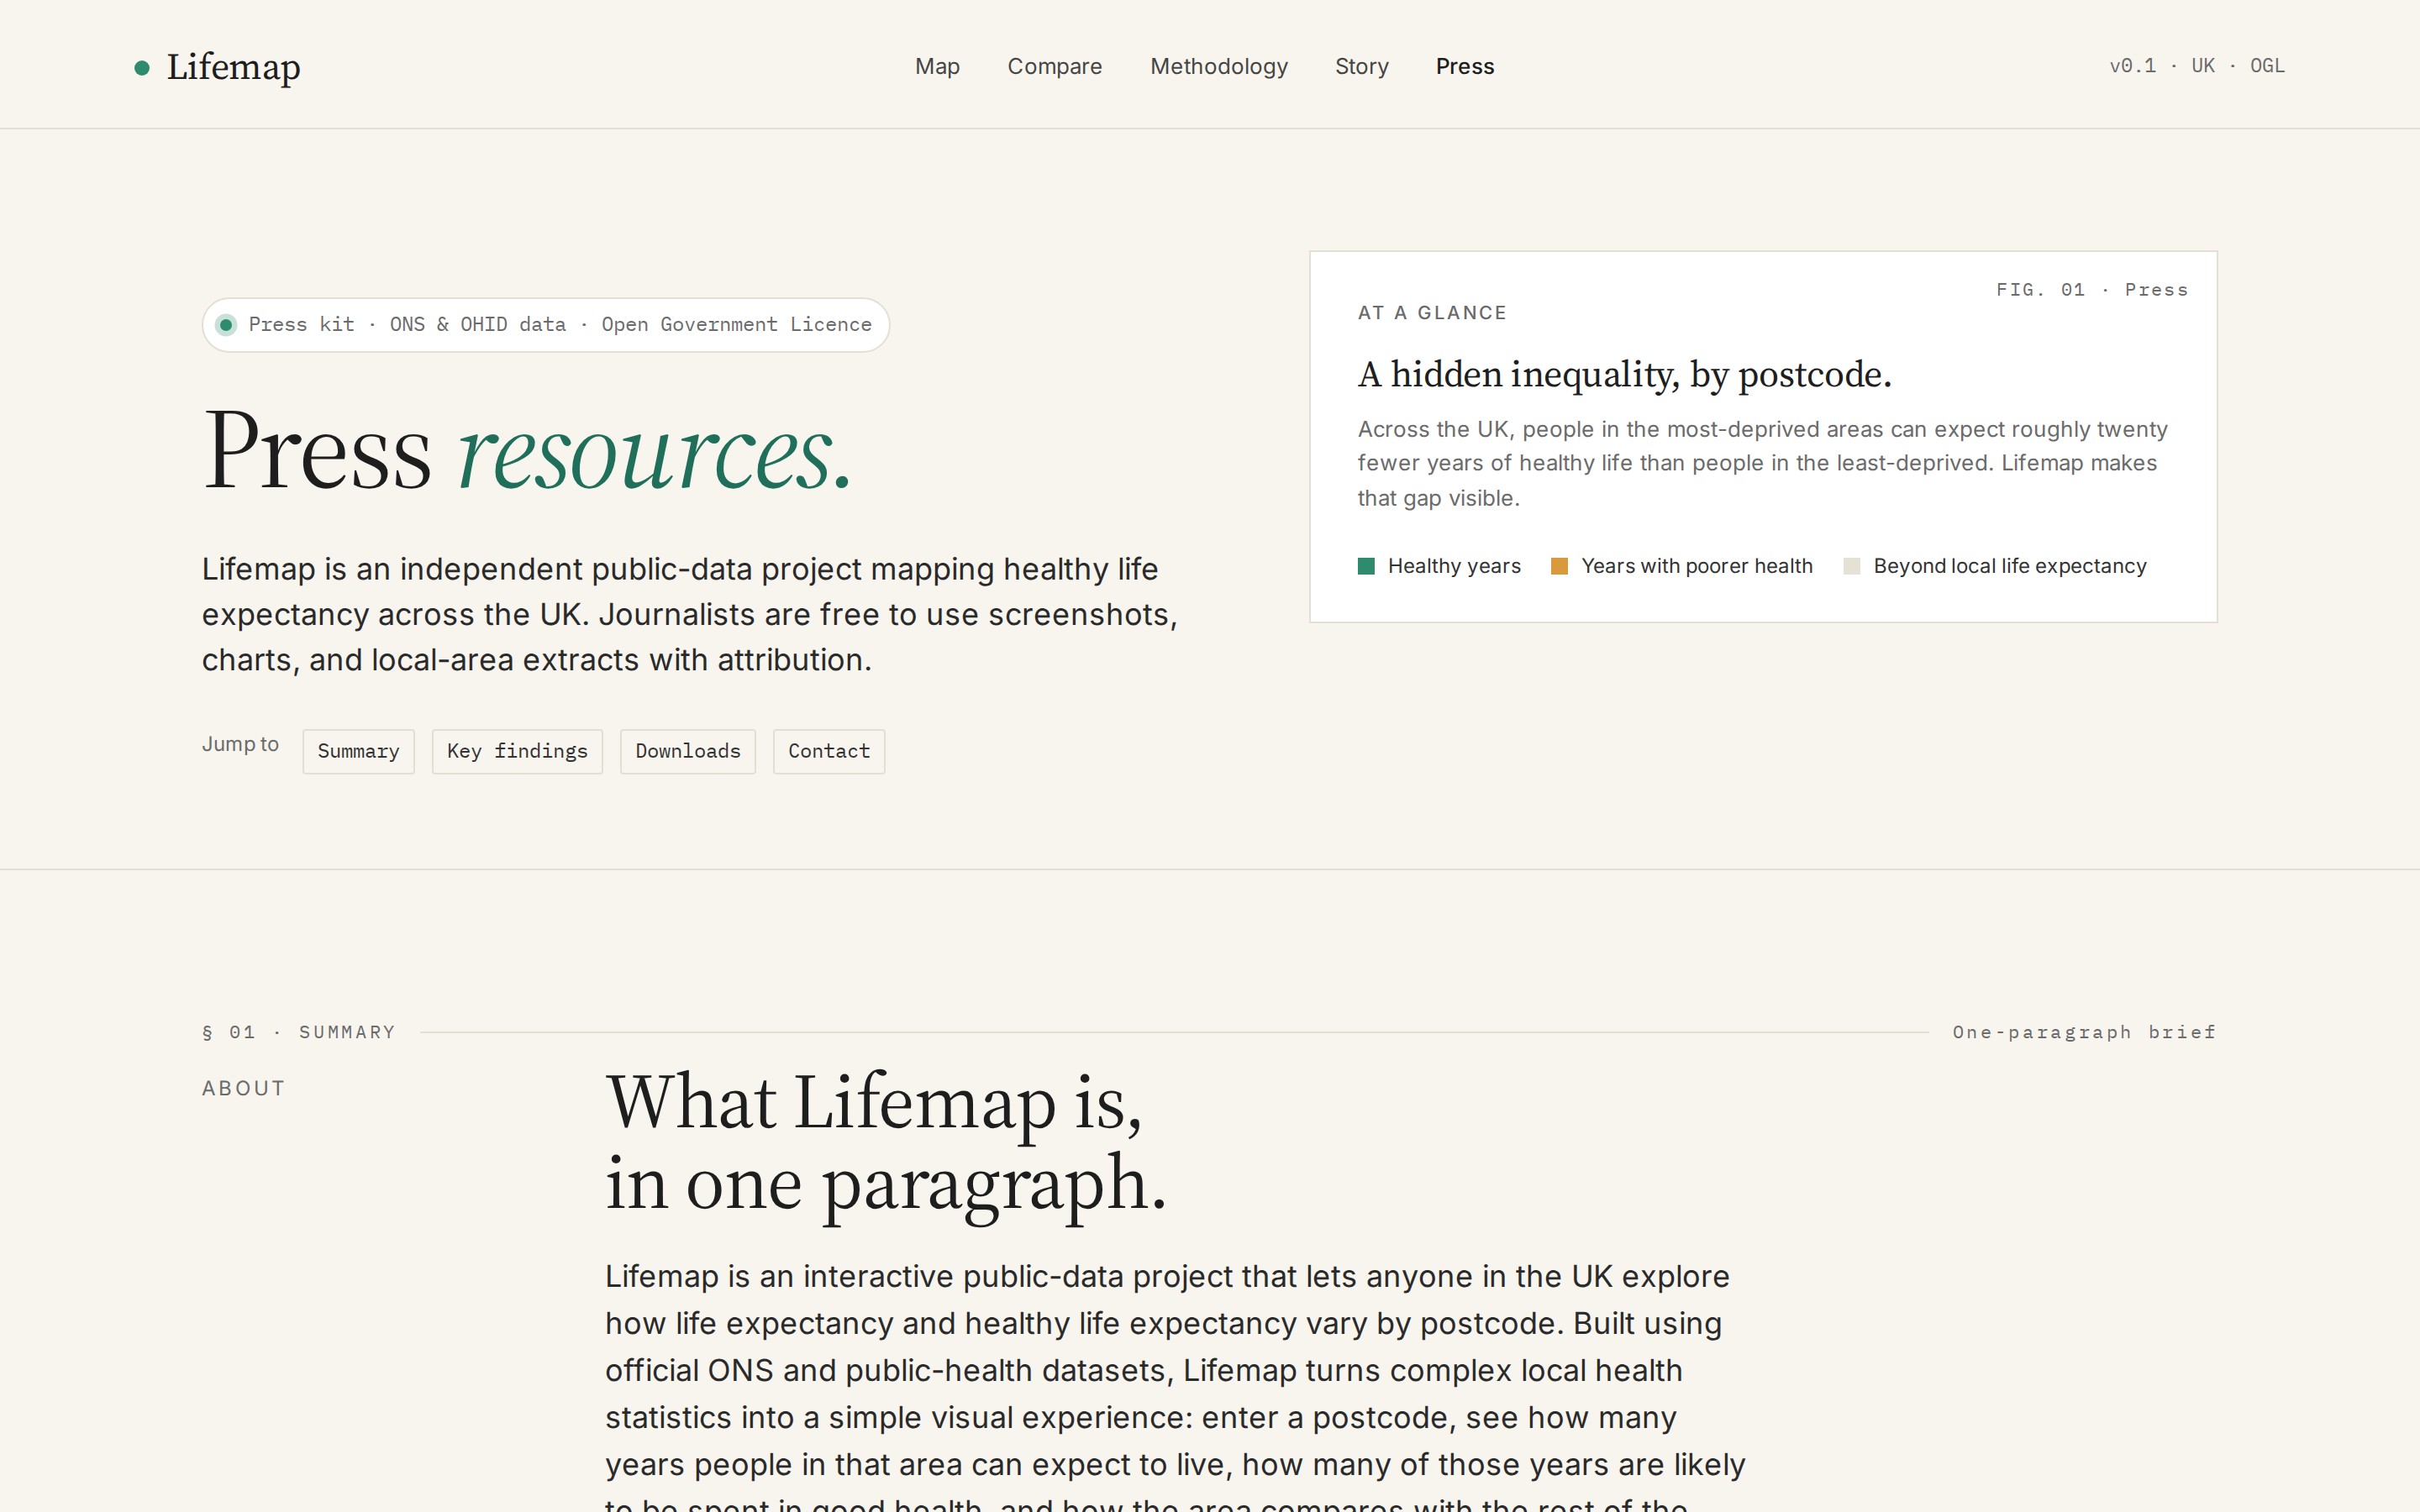
Lifemap is an independent public-data project mapping healthy life expectancy across the UK. Journalists are free to use screenshots, charts, and local-area extracts with attribution.
Lifemap is an interactive public-data project that lets anyone in the UK explore how life expectancy and healthy life expectancy vary by postcode. Built using official ONS and public-health datasets, Lifemap turns complex local health statistics into a simple visual experience: enter a postcode, see how many years people in that area can expect to live, how many of those years are likely to be spent in good health, and how the area compares with the rest of the country. The project highlights one of the UK's most overlooked inequalities: people in different parts of the country are not only living different lengths of life, they are living radically different numbers of healthy years.
"Most people know that life expectancy varies across the UK. Far fewer realise that the gap in healthy years is even more dramatic. Lifemap was built to make that hidden inequality visible in a way anyone can understand, starting with their own postcode."
This quote is cleared for direct use in print, broadcast, and online coverage. Additional comment and on-the-record interviews available on request.
Response window: within 24 hours on UK business days.
Paraphrased from published 2022–2024 ONS and OHID figures. Every number links back to its source in the methodology.
UK healthy-life expectancy at birth — men 63.1, women 63.6 (roughly four-fifths of total life span spent in good health).
Source: ONS, HLE at birth, UK, 2022–2024.
Healthy-life expectancy gap for women between the most- and least-deprived deciles in England (men: 19.4 years). Twenty fewer good years, by postcode lottery.
Source: ONS, HLE by national area deprivation, England, 2022–2024.
Spread between the highest and lowest local-authority HLE figures: roughly 18 years for men (Blackpool to East Dunbartonshire), 21 years for women (Barnsley to Orkney) — from top-performing southern and Scottish-rural areas to the lowest-ranked northern and coastal districts.
Source: ONS HLE by UK LA (2016–2018, frozen series for Wales/Scotland/NI) and OHID Fingertips 90362 (2021–2023, English UTLAs).
UK adult smoking prevalence in 2024 — a record low, and part of the reason the LE / HLE picture continues to shift.
Source: ONS, Adult smoking habits in the UK, 2024.
Lowest male life expectancy of any UK local authority, 2022–2024: Blackpool. More than five years below the UK average.
Source: ONS, Life expectancy for local areas of the UK, 2022–2024.
Lowest female life expectancy of any UK local authority, 2022–2024: Glasgow City. Well below the figures recorded in southern English boroughs.
Source: ONS, Life expectancy for local areas of the UK, 2022–2024.
Free to use with attribution under the Open Government Licence v3.0. The PDF press kit, the JSON dataset, all ten hi-res screenshots and the embeddable chart are live below.
Seven-page brief with summary, founder quote, key statistics, methodology and attribution.
380-record UK extract: life and healthy-life expectancy, smoking, obesity, activity, 5-a-day and higher-risk drinking, keyed by slug. 151 English upper-tier authorities, 164 English districts, 32 Scottish councils, 22 Welsh principal areas, 11 Northern Ireland districts.
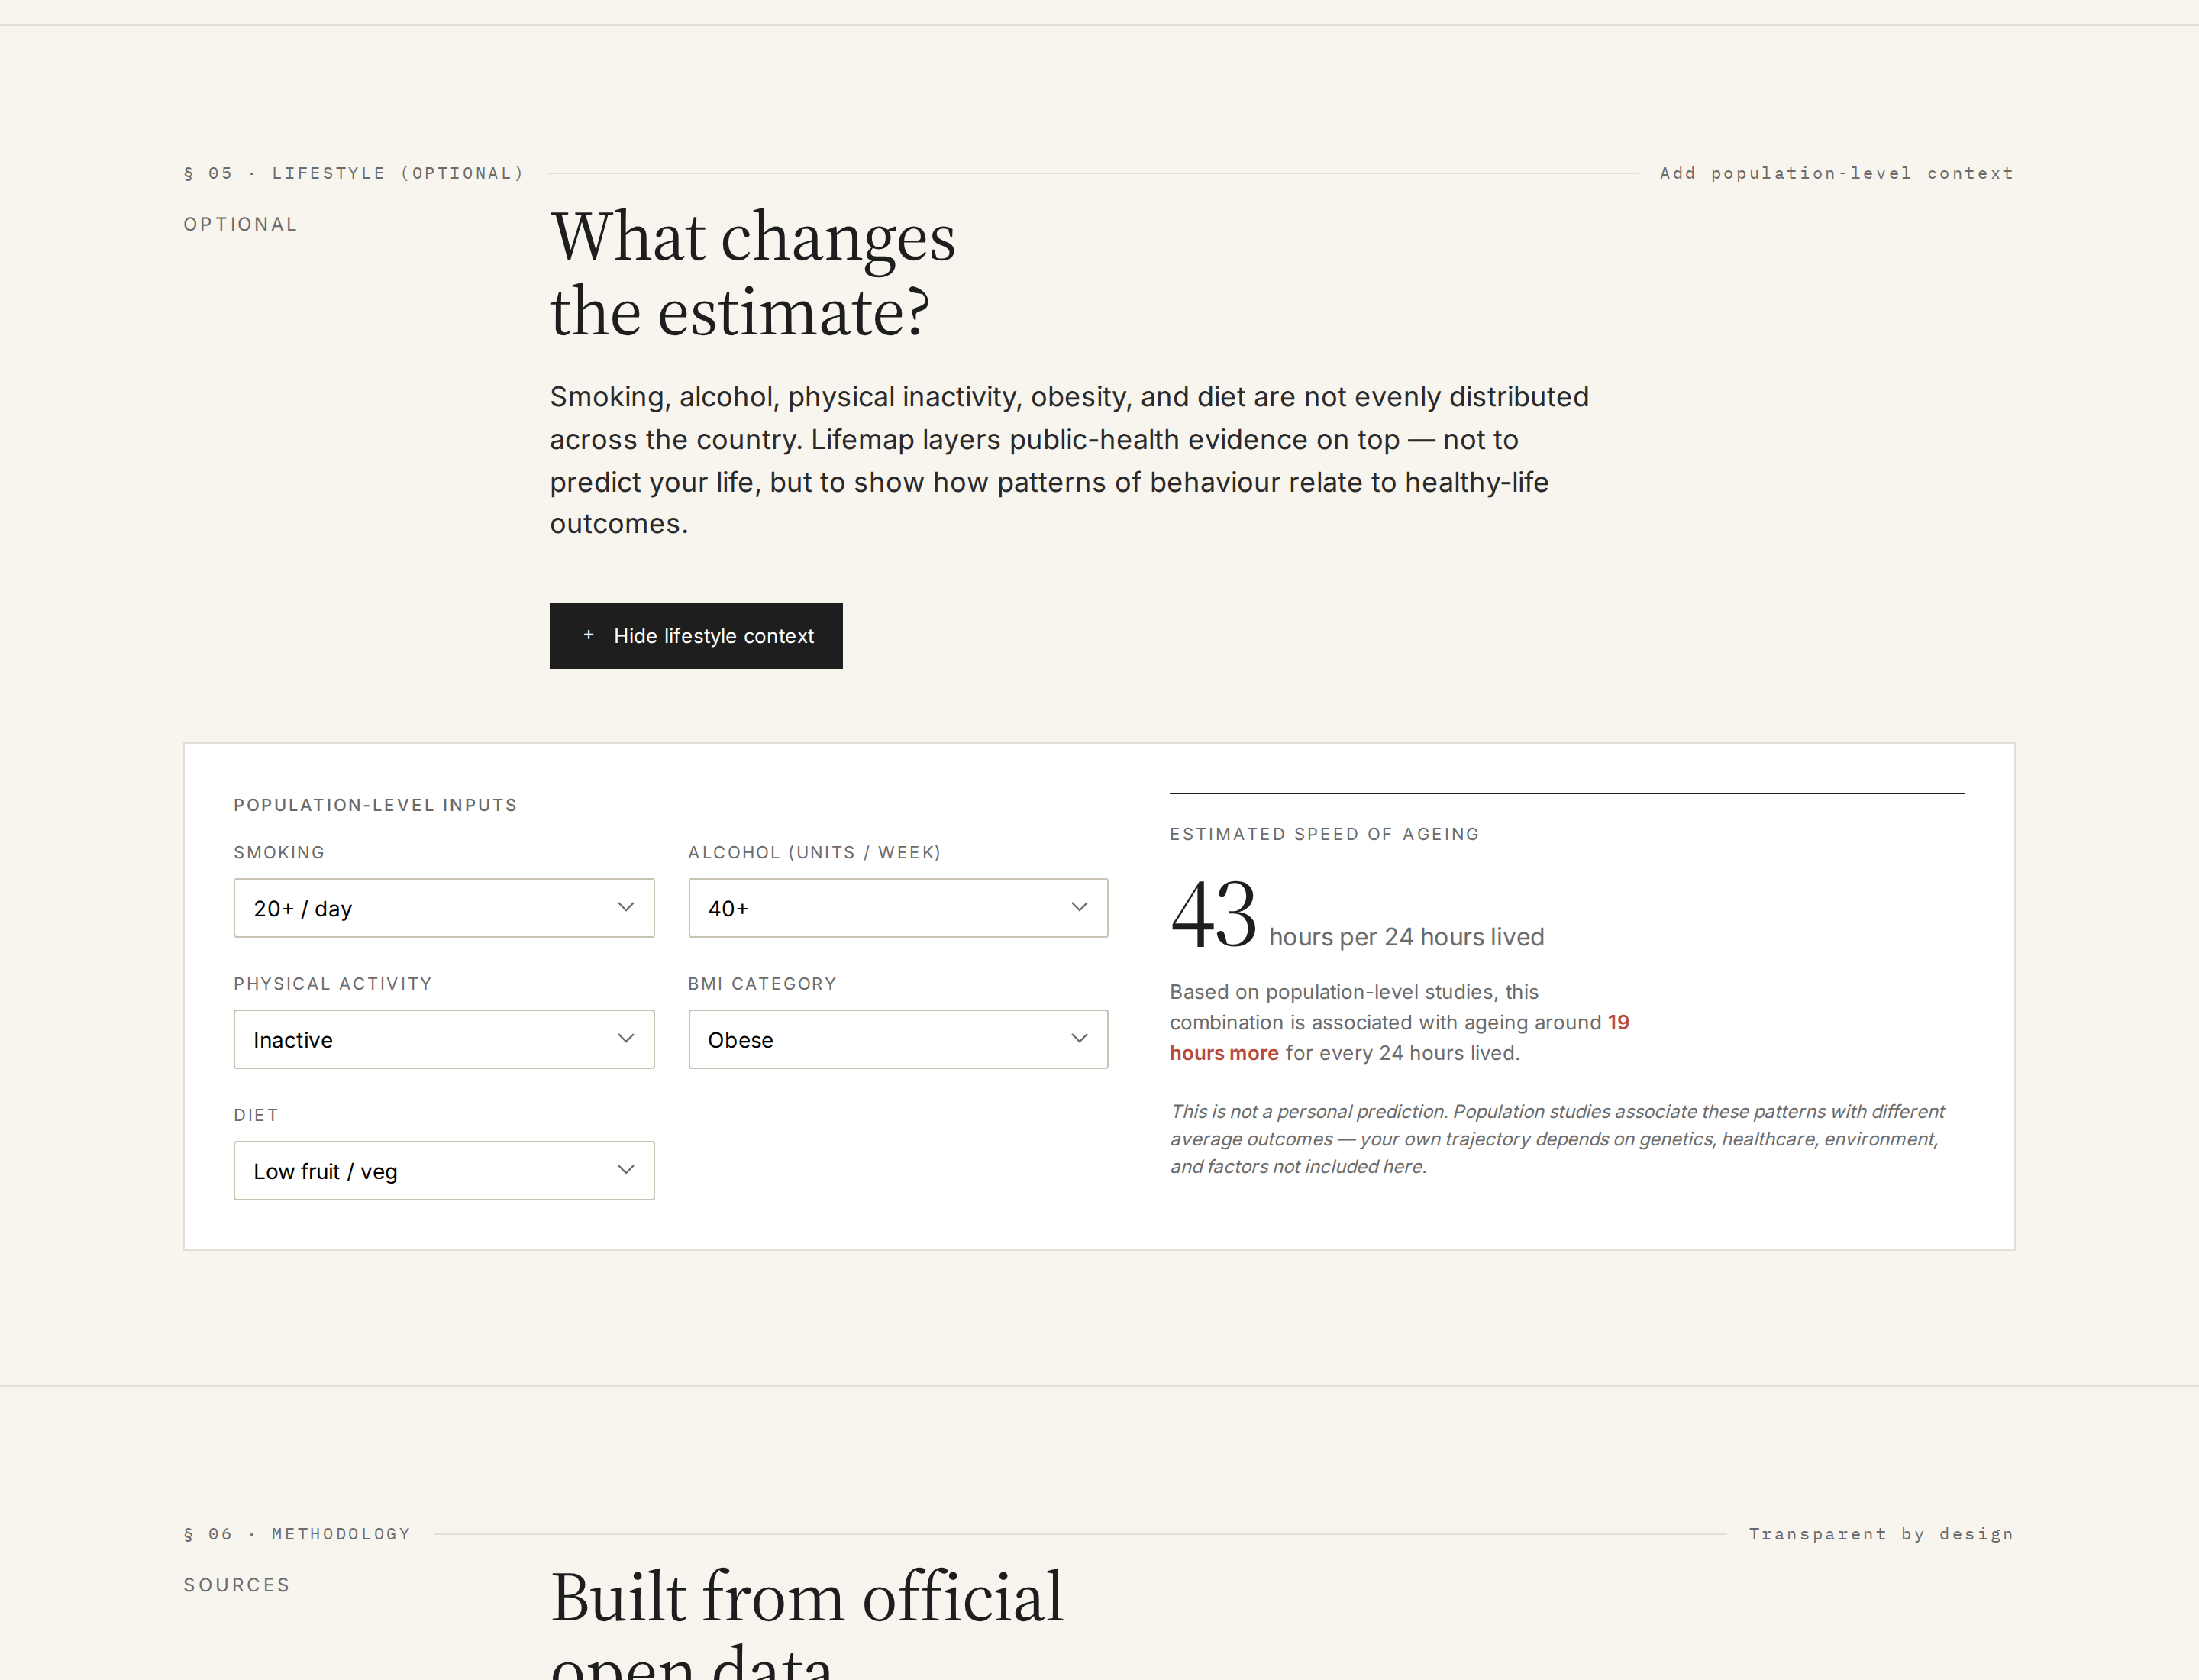
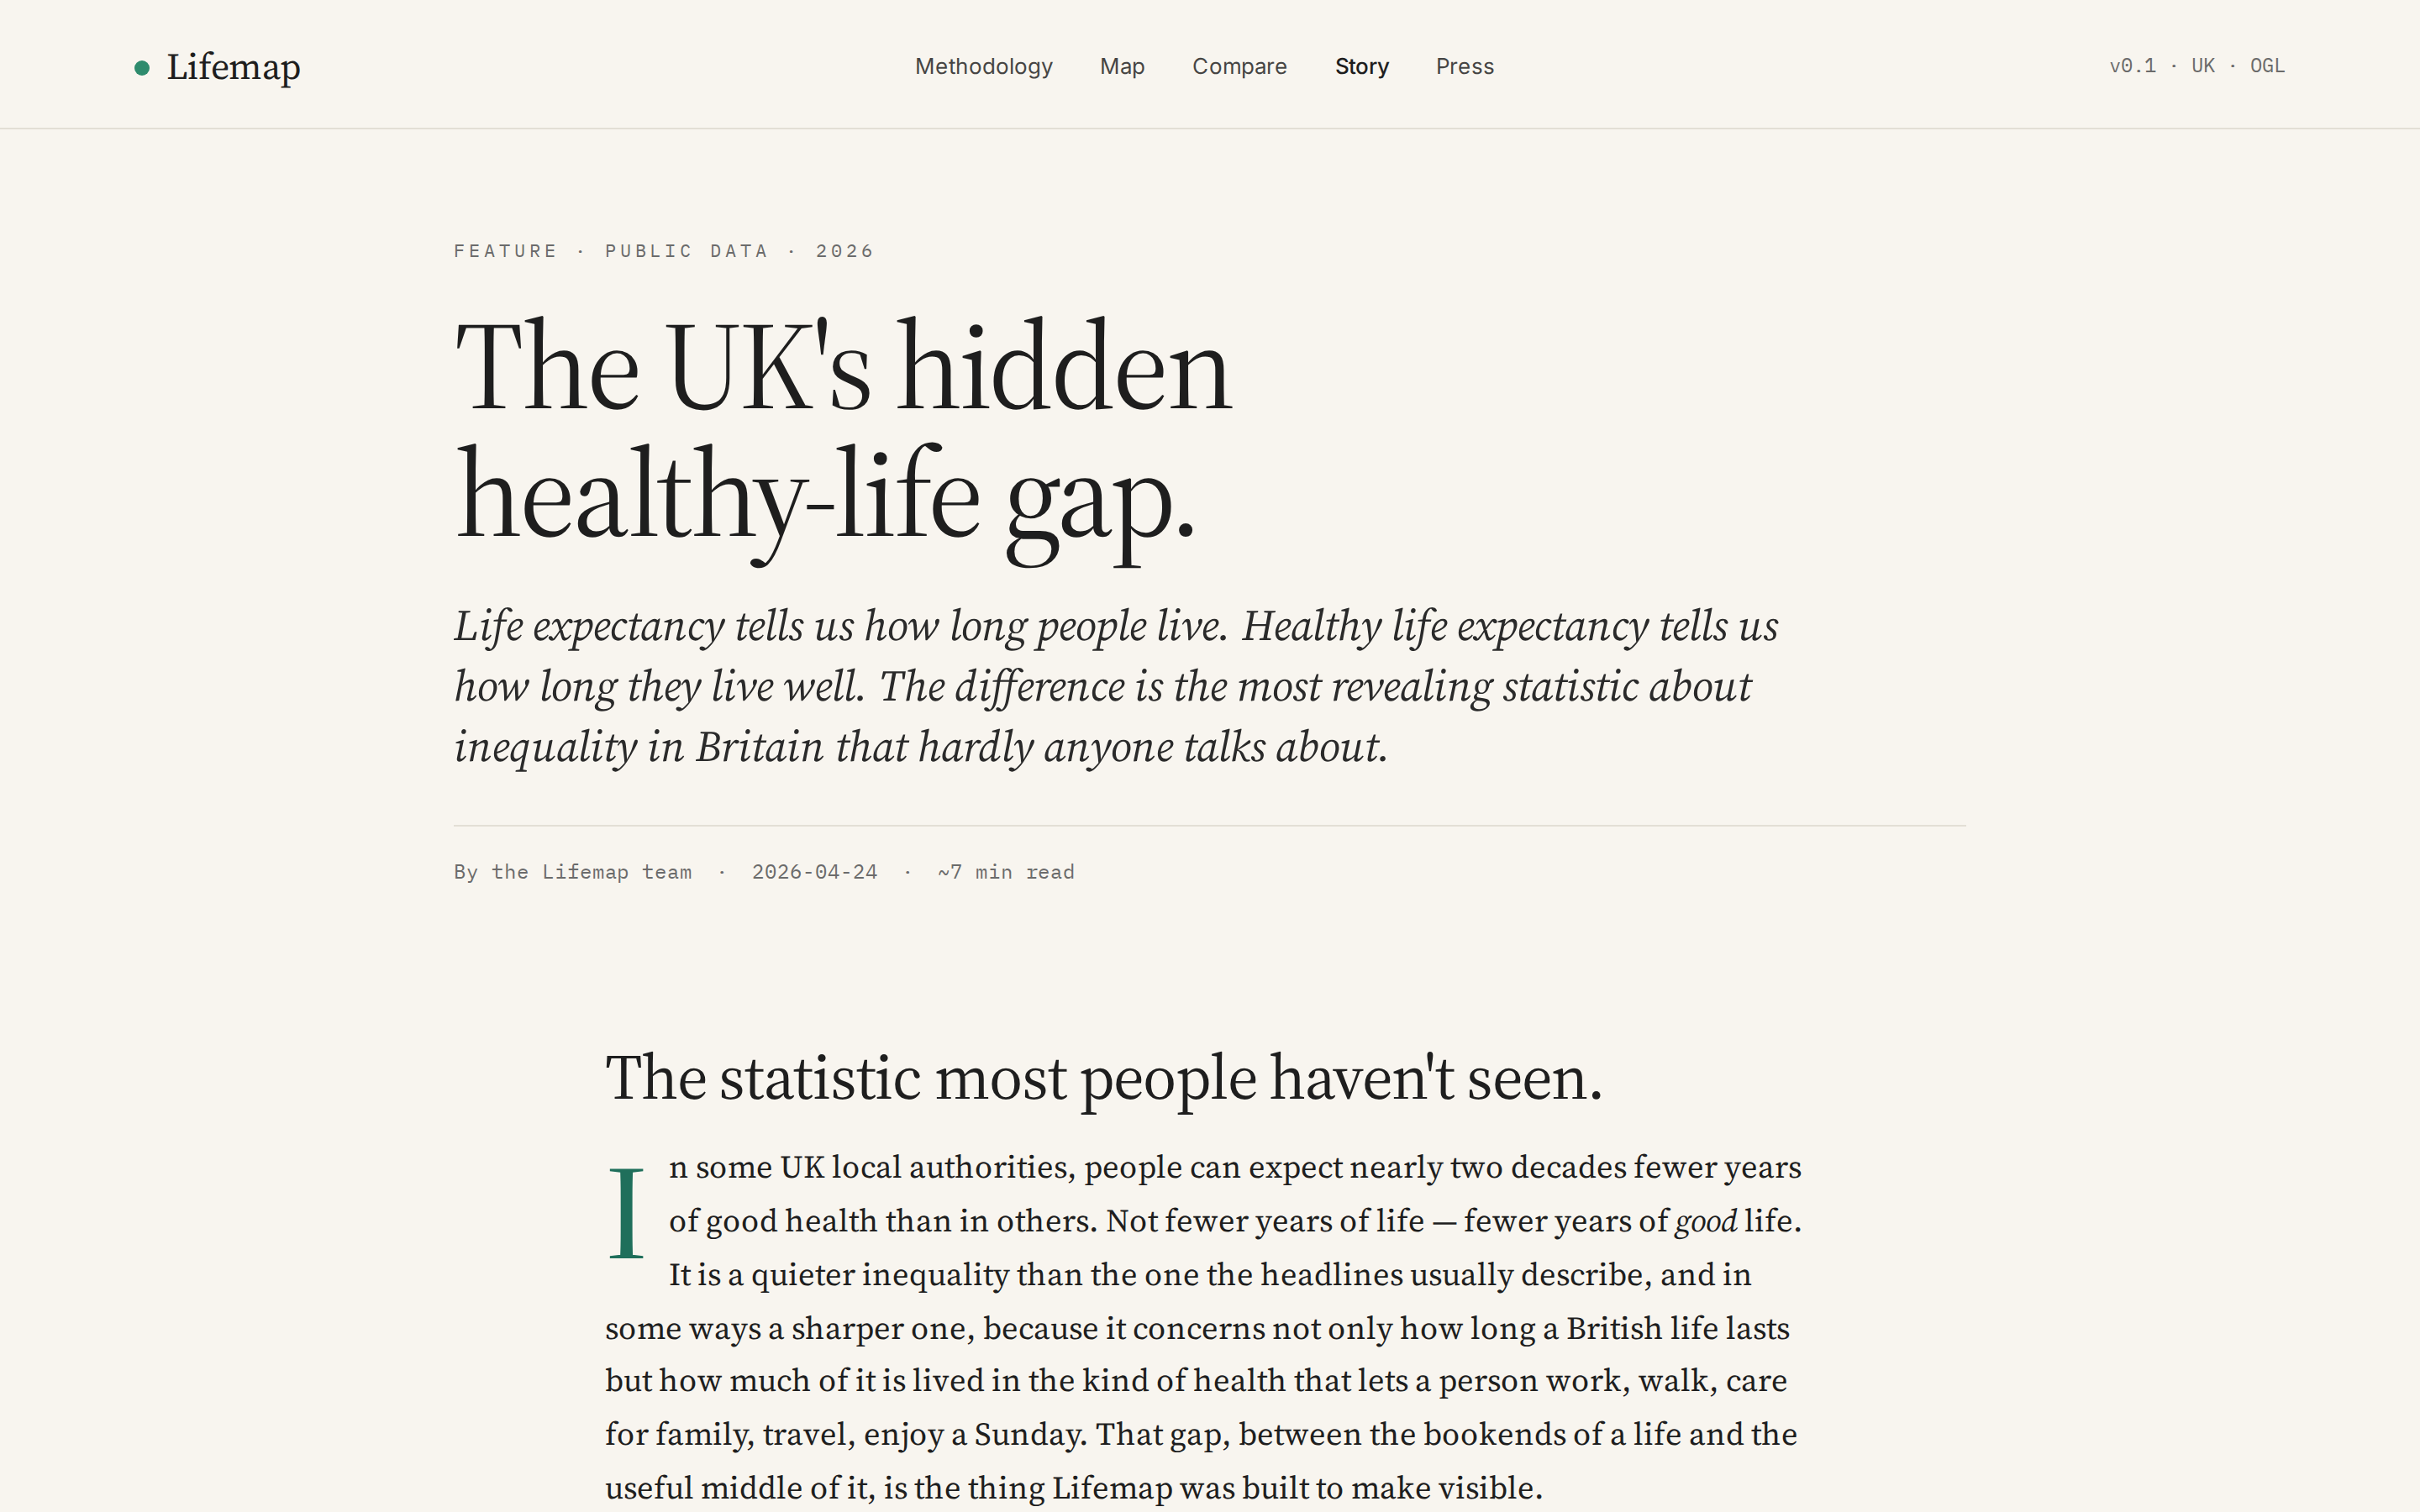
Ten 2× DPR captures: hero, result, compare, choropleth map, lifestyle, story, mobile views.
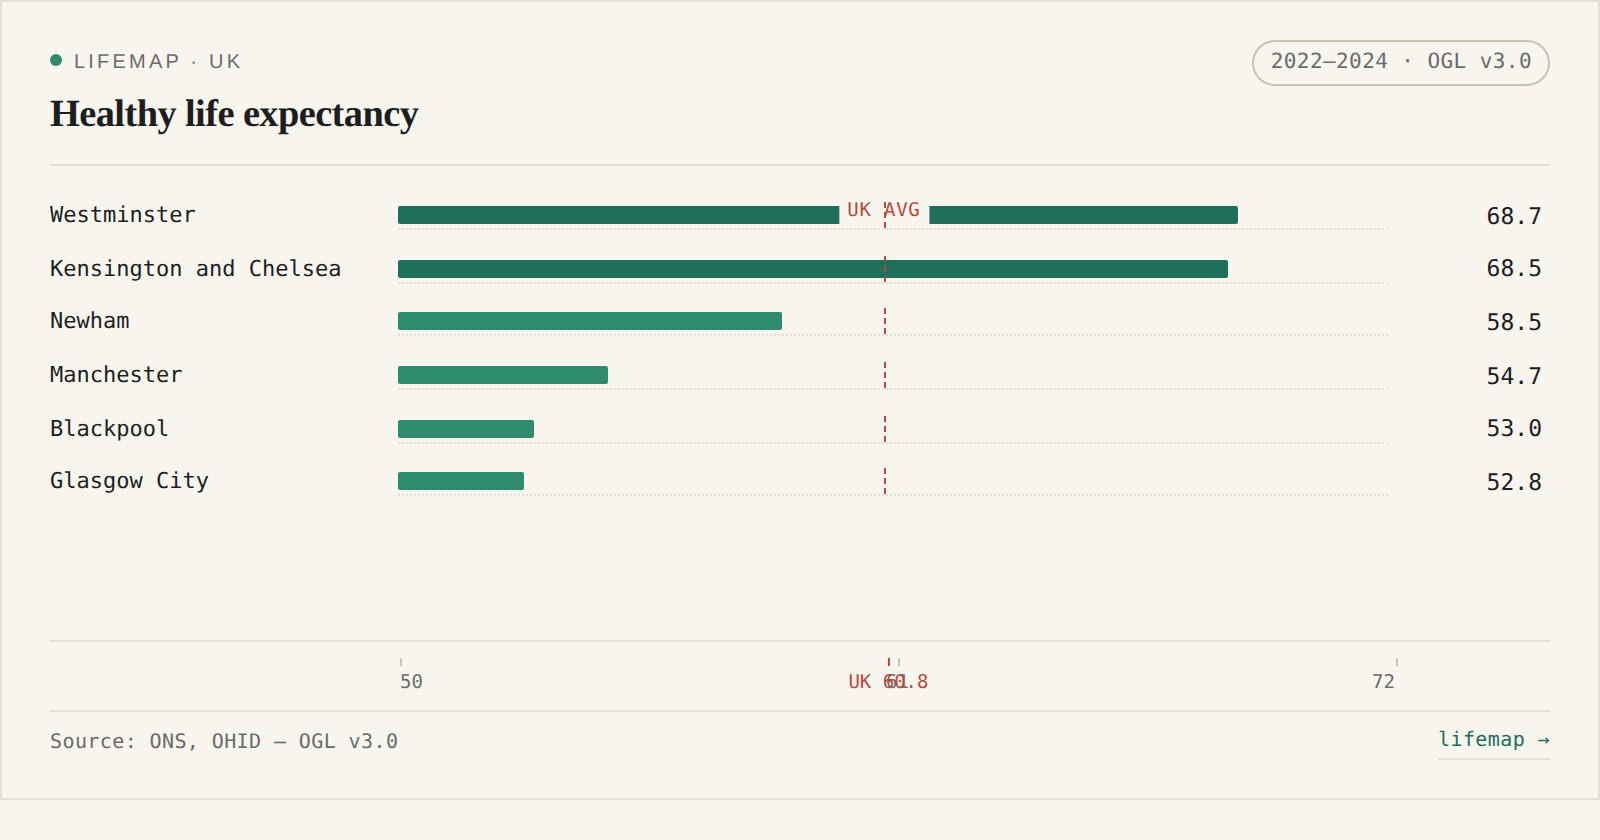
Drop-in iframe with metric + area parameters. Renders any subset of the 380-record dataset.
Copy this snippet into your CMS (HTML / WordPress code block / Substack iframe block):
<iframe src="https://lifemap.org.uk/embed/?metric=hle&areas=westminster,blackpool,glasgow%20city"
width="100%" height="420"
style="border:1px solid #E3DFD5"
loading="lazy" title="Lifemap chart"></iframe>
Slug list: any key in uk_la_data.json (e.g. westminster, kingston upon hull, stoke-on-trent). 380 council records covered.
All figures trace back to public UK government data. Reuse is permitted under the Open Government Licence v3.0 with attribution.
Life expectancy (UK LA, 2022–2024); HLE by national area deprivation (England, 2022–2024, released 15 April 2026); HLE by UK LA (2016–2018, frozen series for Wales / Scotland / Northern Ireland).
HLE for English UTLAs (90362, 2021–2023); smoking (91547), obesity (93088), physical activity (93014), 5-a-day (93982); higher-risk drinking via above-guideline indicator (92778, >14 u/wk; broader than the legacy >50 / >35 u/wk definition).
Lifestyle prevalence for Scotland (SSCQ 2023, SHeS 2014–17) and Wales (Welsh Health Survey 2014–15). Northern Ireland lifestyle data not currently available.
Open postcode-to-area lookup. All source data is published under the Open Government Licence v3.0 for public reuse and attribution. Full source list: lifemap.org.uk/sources/.
We can provide local extracts, chart exports, and founder comment tailored to any of these story angles.
Why the gap in healthy years between UK areas is larger than the gap in total life expectancy.
How two postcodes within the same city can differ by a decade of healthy years.
Living longer isn't the same as living well. What healthy-life expectancy actually measures.
Coastal towns, post-industrial cities, and commuter belts: a geography of outcomes.
What civic data projects can do when ONS, OHID and OGL are used well.
We aim to respond to journalist enquiries within 24 hours on UK business days. Same-day turnaround for outlets on deadline — please flag in the subject line.
For local-area extracts, chart exports, or on-the-record comment, email with: